project overview
Viridity Energy develops, builds, owns and operates advanced Lithium-ion battery storage systems at various throughout the United States.
Access to essential data at each site location is necessary to maximize operational efficiency and provide an overview of the value of assets.
the opportunity
Viridity Energy needed a streamlined view of their battery storage assets showing data that represents the efficiency of operations as it relates to
the cost value of these assets for present and future growth opportunities.
Data scientists on the team devised a way to maintain oversight over these assets as compared to the manufacturer’s warranty guarantee.
A long term overview of these assets enables Viridity Energy to adjust and test scenarios that have an effect on the warranty performance.
the team
Data Scientist, Solutions Engineering Intern, Asset Manager, Data Storage Engineers, Product Designer.
“...working with your design prototypes has enabled me to realize how to solve a puzzle that I was unable to see until now.”
phase 1: the long view
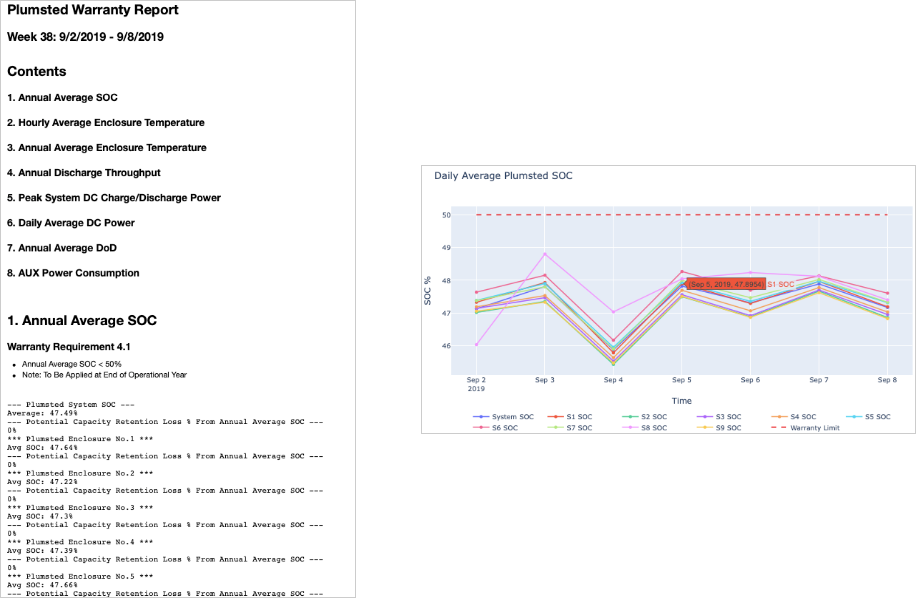
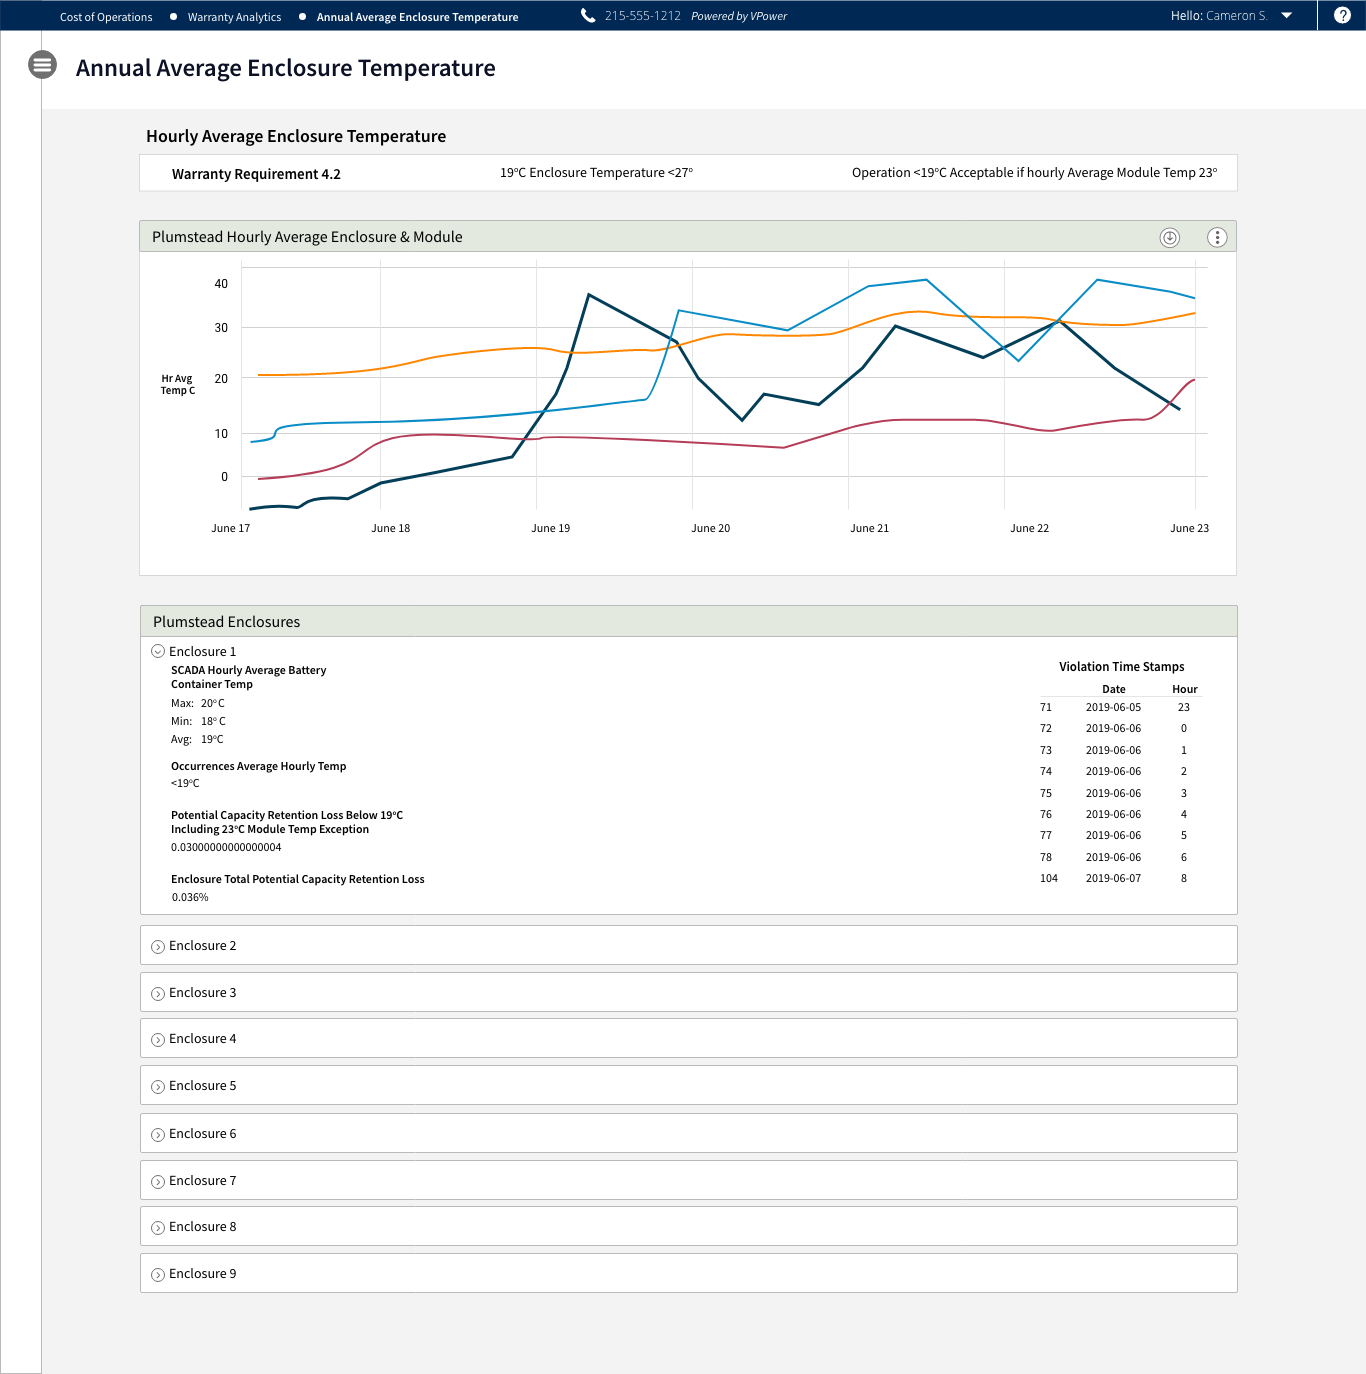
Originally the goal of the project was to provide a better view of the html generated by Juypter Notebook for both the engineering and executive management teams. This report contained data related to the warranty as applied to each enclosure. VESI’s asset storage consists of batteries that are housed in enclosures residing on sites throughout the United States. The email contained very relevant data with six related attachments that was undesirable and proved unmanageable for the audience to parse through on a weekly basis.
phase 1: prototype
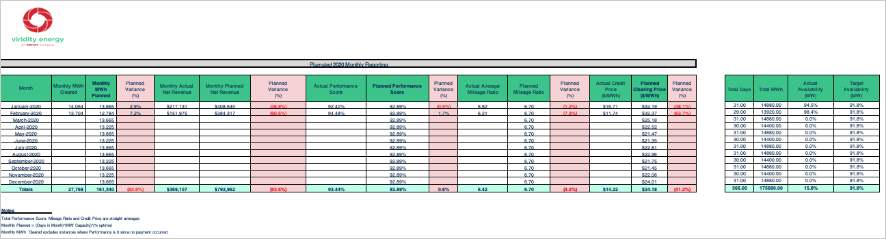
phase 2: the longer view
personas
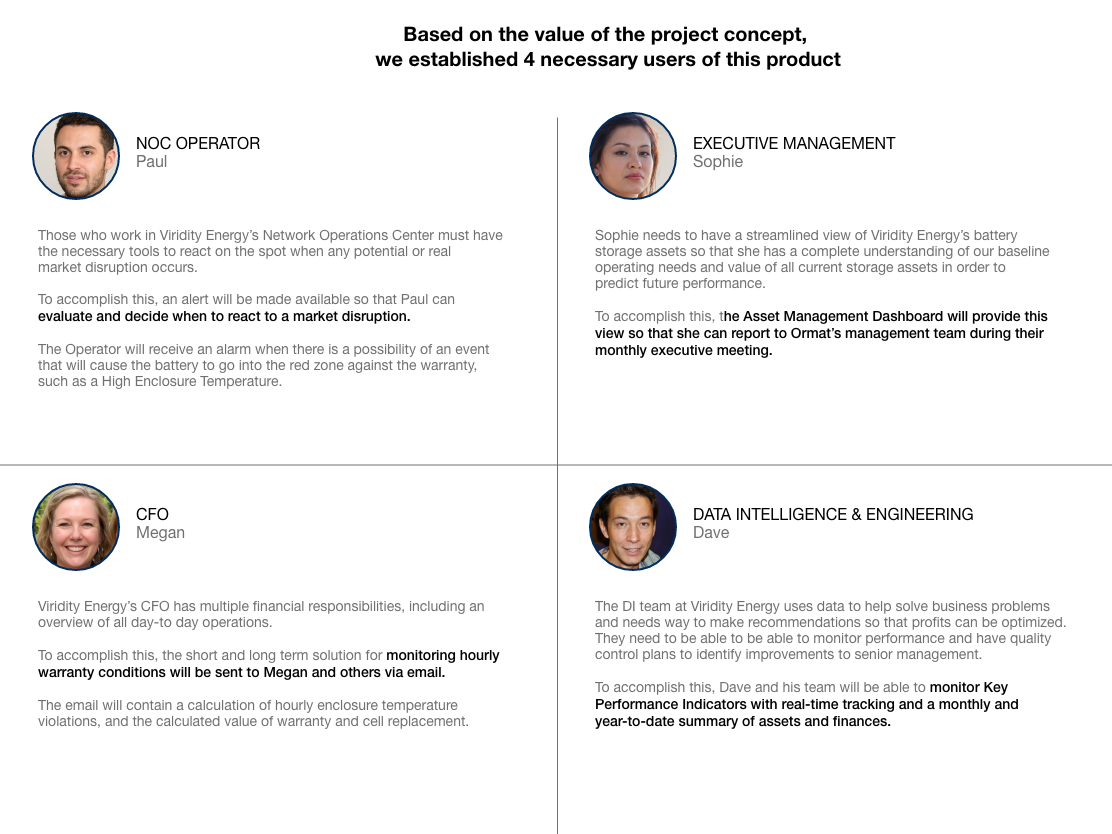
Because the Operations Cost project now included additional components for the benefit of disparate team members, I developed a set of four personas to ensure we were meeting the goals of our users.
phase 2: prototype
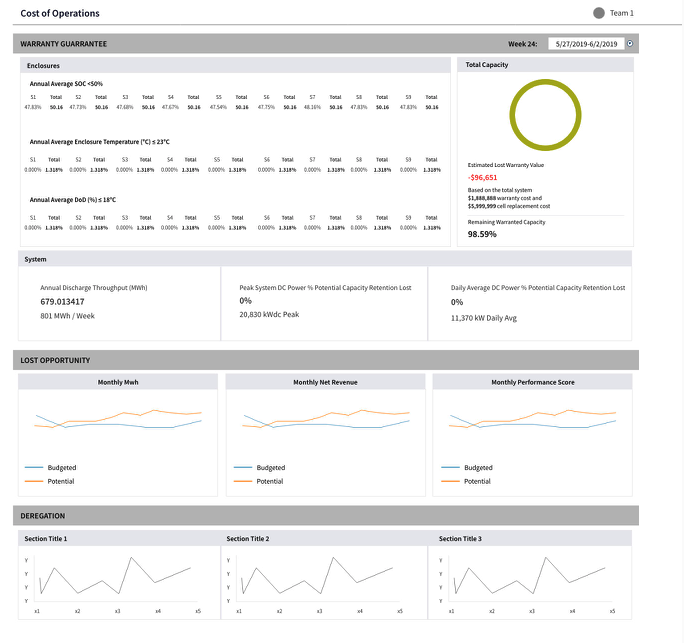
Concept to get feedback and iteration with stakeholders started. At this phase, the project was renamed to Cost of Operations
final outcome
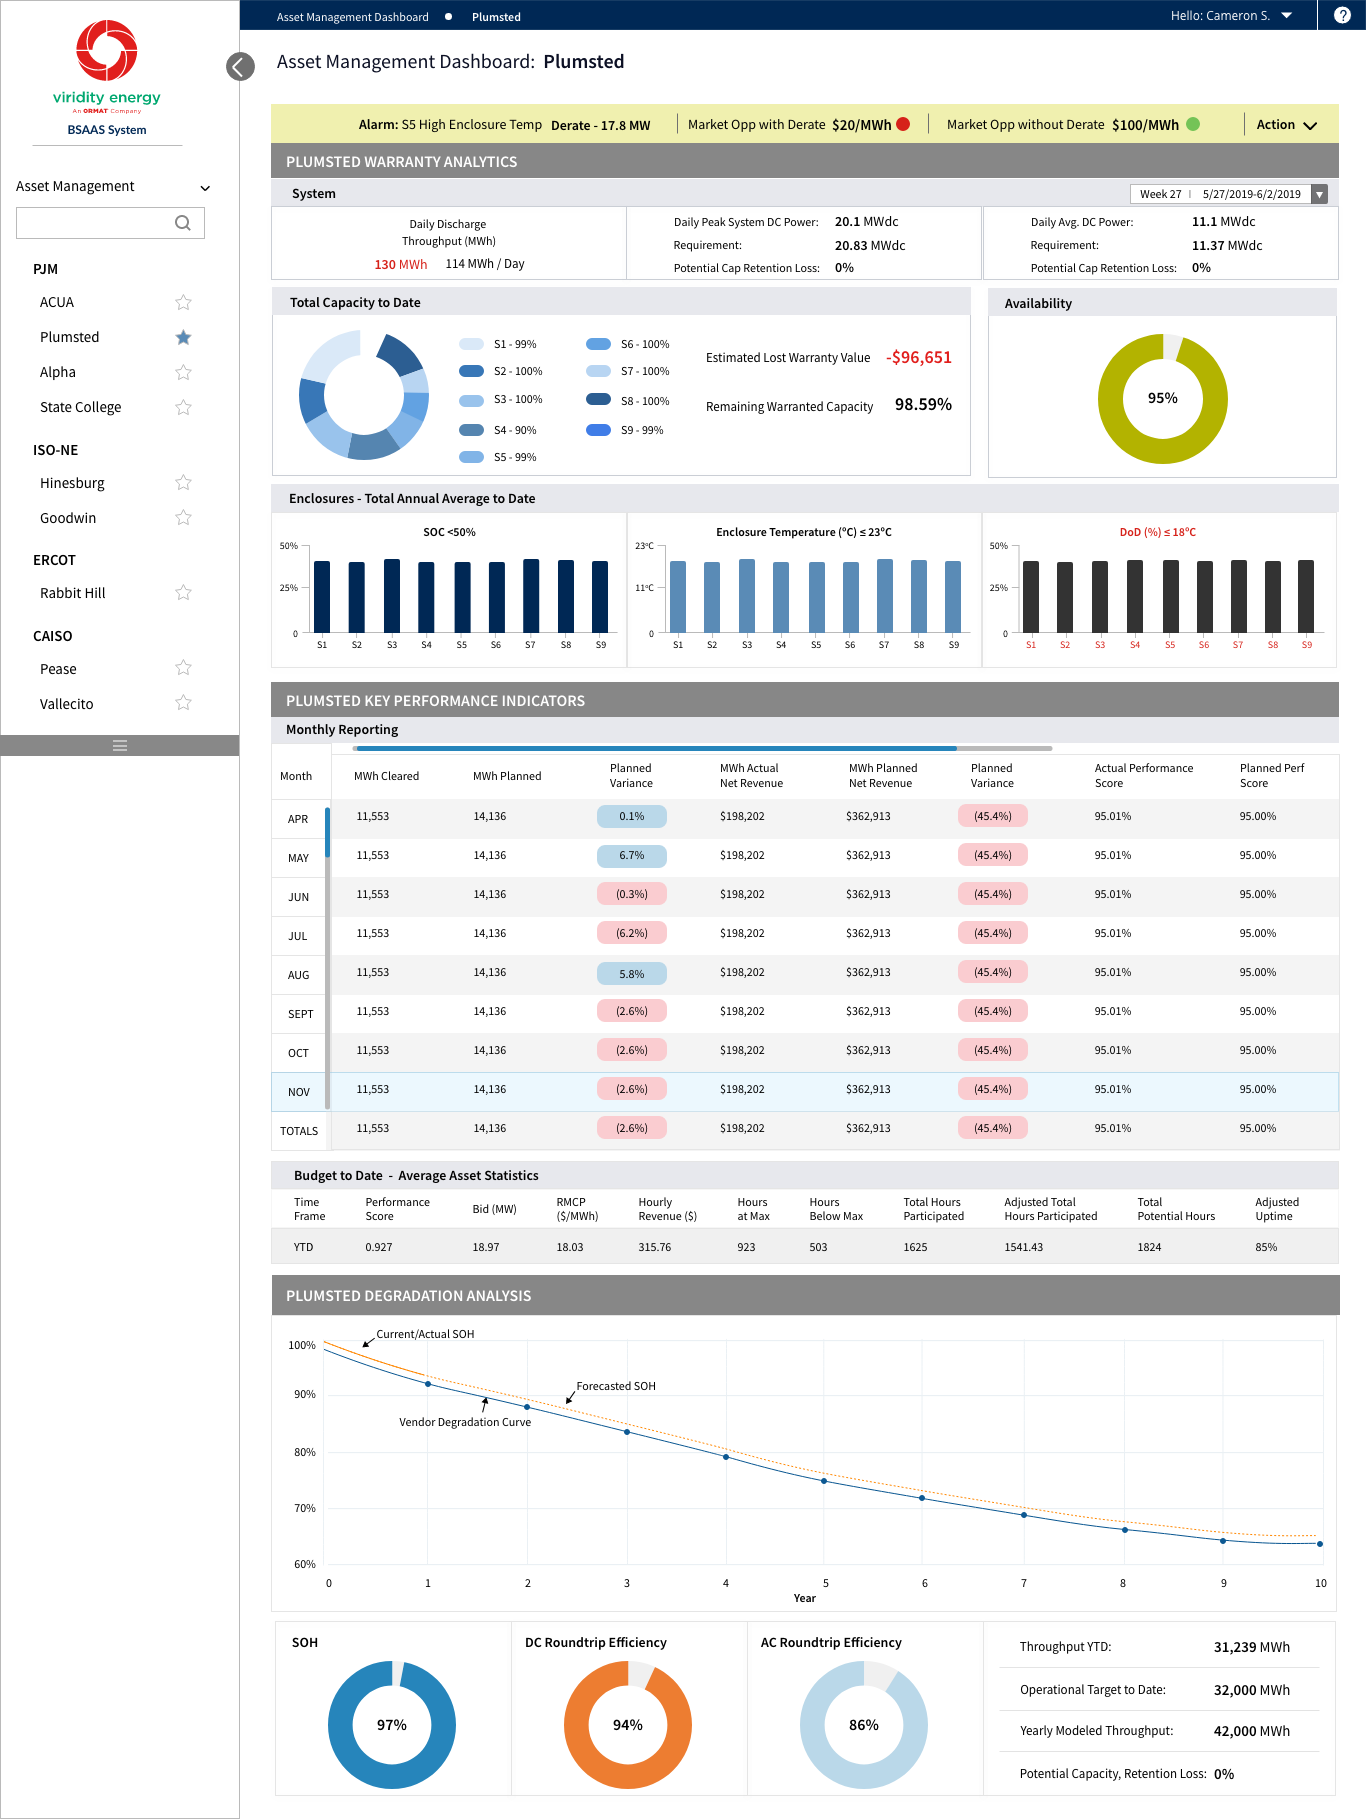
Wanting to avoid my design to suffer from information overload, I quickly realized that graphs and the proper pictorial representation of the large sets of data were the way to tell the story. My goal was to weave these number sets into an integrated design that would produce a seamless integrated and desirable product. Working with the data scientist on the team enabled me to accurately solve for which data points should catch the eye and if the difference between visualizations should be highlighted.
user testing
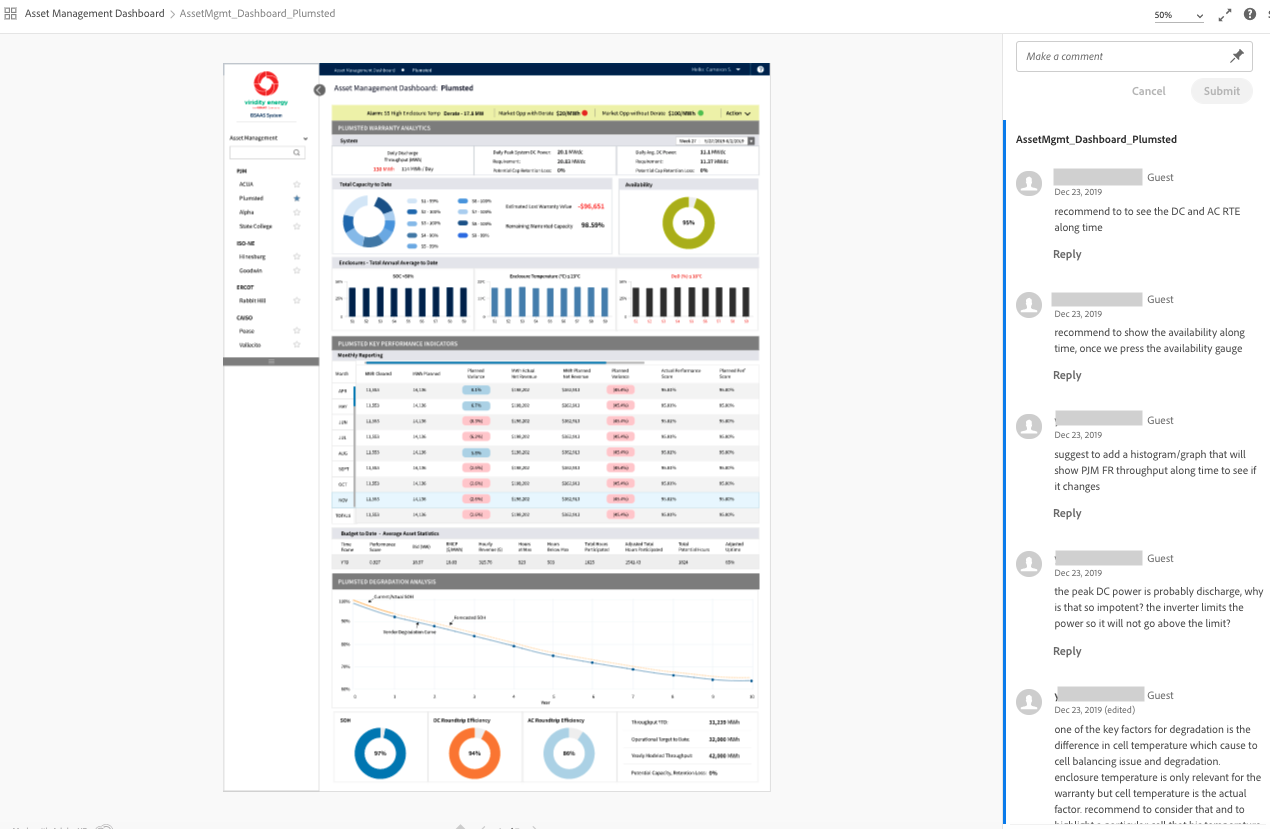
A remote, structured approach to user testing validated our assumptions, enabling us to confidently implement our MVP. The user feedback we received gave the team unrealized ideas for new products to benefit the engineering team.
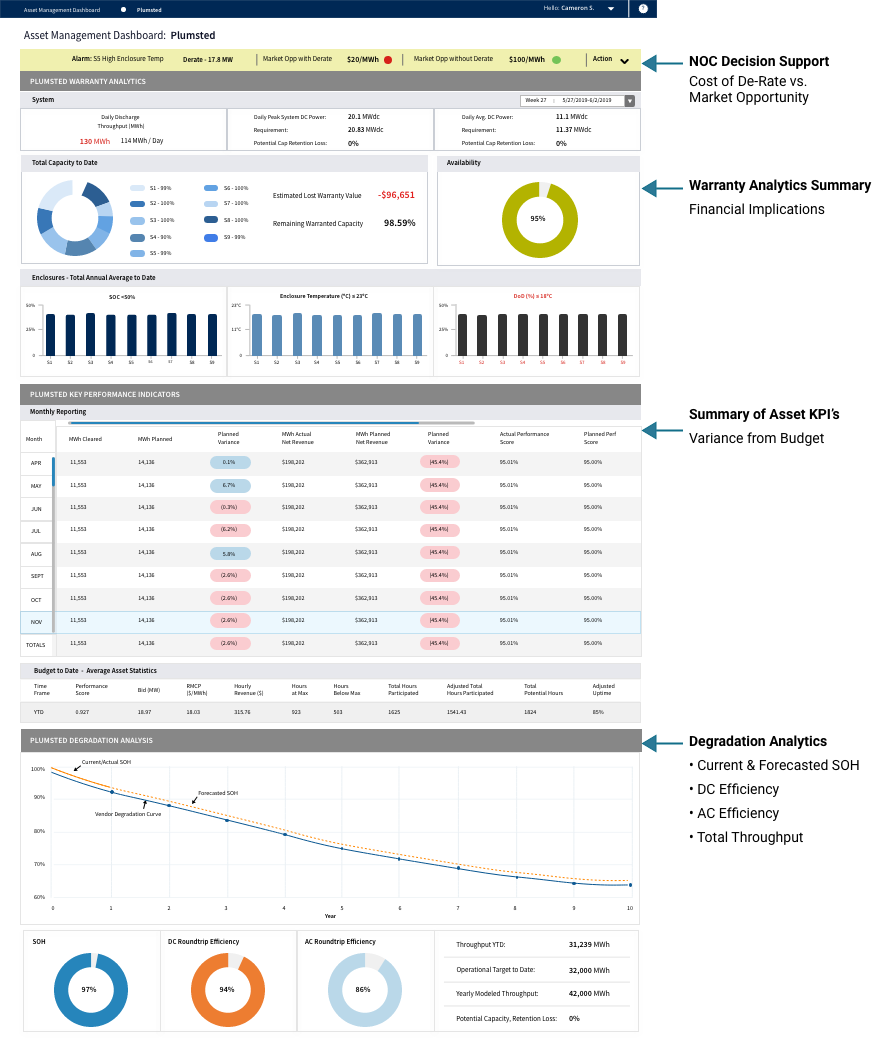
a product with many useful features